IELTS Writing Task 1 | Cách viết mô tả biểu đồ bảng (table) dạng đơn giản
Đề bài yêu cầu bạn viết lời mô tả cho biểu đồ với dạng bảng (table) đơn giản trong khoảng trên 150 chữ. Phần thi task 1 không yêu cầu bạn đưa ra ý kiến cá nhân. Bạn nên dành khoảng 20 phút để hoàn thành đề bài này. Số điểm mà bạn đạt được trong phần task 1 ít hơn task 2, do đó bạn bên đảm bảo hoàn thành bài viết trong khung thời gian giới hạn là 20 phút để có thể dành 40 phút còn lại để làm phần viết bài luận (essay) của đề thi.
3 điều mà bạn phải đạt được trong phần thi task 1:
- Viết mô tả đúng thông tin trọng tâm của đề bài
- Lời văn dạng mô tả thông tin liên quan tới biểu đồ, không được sử dụng ý kiến cá nhân.
- Sử dụng đúng từ vựng và các cấu trúc ngữ pháp.
I. Tìm hiểu về câu hỏi IELTS Writing 1 dạng viết mô tả bảng số liệu (table)
1. Dạng thông tin được trình bày trong bảng được sử dụng cho mục đích gì?
Bảng được sử dụng để hiển thị 2 loại thông tin (hàng ngang, cột dọc) chứa đựng các số liệu cho mục đích tính toán và so sánh.
2. Trước khi viết mô tả
Trước tiên bạn đọc để phân tích thông tin trình bày trong bảng. Bạn phải chắc chắn là đã hiểu những thông tin:
1- Tên các tiêu đều trong hàng đầu tiên
2- Tên các tiêu đề trong cột đầu tiên
3- Lưu ý đến đơn vị hiển thị trong bên dưới các tiêu đề trong hàng hoặc cột.
Phân tích tiếp theo đến mối liên quan giữa các số liệu có trong hàng và cột. Hãy tính toán và so sánh số liệu có trong mỗi danh mục (theo hàng/ theo cột). Tìm kiếm xu hướng chung của nó (tăng/ giảm)
Có thể có rất nhiều thông tin được đề cập trong bảng. Hãy chọn ra những thông tin quan trọng nhất hoặc nhóm (gom) các thông tin có tính đồng dạng để biết mô tả dựa trên điểm chung của chúng.
3. Cấu trúc bài viết
Bài viết nên được chia làm 4 đoạn trong đó:
Đoạn mở đầu (Introduction)- Viết 1 đoạn: giới thiệu nội dung của đề bài và thông tin chung được hiển thị trong bảng
Đọan thân bài (Body) – Viết 2 đoạn (hoặc có thể 3 đoạn): bạn có thể dựa trên số lượng cột hoặc hàng để phân thanh các đoạn trong phần thân bài. Mỗi đoạn hãy viết theo cách so sánh (so sánh nhất, so sánh hơn/kém, so sánh bằng). Hoặc nếu bạn không biết cách viết so sánh hãy mô tả chúng.
Đoạn kết bài (Conclusion) – Viết đoạn 1: Tìm ra xu hướng chung, tổng quát nhất của toàn bộ thông tin có trong bảng.
II. Câu hỏi dạng viết mô tả biểu đồ bảng và hướng dẫn từng bước
1. Câu hỏi 1
a. Tìm hiểu đề bài dạng tables
Với đề bài này, bạn sẽ tìm hiểu nội dung trong một bảng kết quả khảo sát về các thông tin đi lại với các phương tiện khác nhau. Bên cạnh đó việc xác định các thông tin ở mức trung bình (khoảng cách/ tốc độ/ thơi gian) bạn cũng có thể tìm được mối liên quan giữa các cột. Nếu bạn tìm ra được sự liên quan giữa những con số lớn nhất/ nhỏ nhất trong các cột khác nhau thì bạn sẽ biết cách viết phần tóm lượt (summary) của bài mô tả.
Trả lời các câu hỏi sau:
Which ways of travelling:
1. do people use for the longest journeys? [car – more than one person]
2. do people use for the shortest journeys? [cycle/walk]
3. take the most/least time? [most: train/bus least: cycle/walk]
4. are fastest/slowest? [fastest: car-more than one person slowest: walk]
Hãy so sánh các thông tin đi lại trong bảng khảo sát trên ở Mỹ so với nơi bạn ở về các thông tin: khoảng cách, tốc độ và thời gian đi lại.
(Lưu ý: áp dụng các cấu trúc so sánh bằng/ hơn-kém/ và so sánh nhất.)
b. Bài viết mẫu:
The table gives information about different means of transport which people use to reach their work in one city in the US.
People who use public transport or share a car travel the greatest distance, on average 23 or 24 miles, while cyclists and pedestrians have the shortest journey – just 4 miles. By comparison, car drivers without passengers travel an average of 17 miles.
People travelling on trains and buses spend the longest time commuting to work because it takes them 49 minutes on average. Walkers and cyclists take the least time, because they get to work in about 20 minutes.
Cars tent to be the fastest way of travelling. People going together by car have a average speed of 34 mph and people driving alone have an average of 31 mph. Walking is the slowest at 3 mph.
Overall, for long distances, the quickest way to travel to share a car, but for short distances, walking or cycling is the best.
- Đoạn 1: Cho biết nội dung của bảng.
- Đoạn 2: So sánh khoảng cách
- Đoạn 3: So sánh thời gian
- Đoạn 4: So sánh tốc độ
- Đoạn 5: Tóm lại nội dung của bảng.
2. Một ví dụ khác về dạng đề table kết hợp chart
a. Tìm hiểu đề:
Tuy đề bài này yêu cầu mô tả kết hợp giữa bảng và biểu đồ cột. Tuy nhiên, biểu đồ cột chỉ đóng vai trò như một thông tin thêm vào cho bảng (Cột dọc thông tin thứ 3). Chỉ có điều dữ liệu đầu tiên ở cột dọc có chút thay đổi giữa “car (more tha 1 person)” và “car-4 people”
Hãy trả lời các câu hỏi sau:
1. what does the table show? [the percentage of people who use each form of transport and their average age]
2. Which is the most common means of transport? [car (one person)]
3. which is the least common [cycle/ walk]
4. Which group of travellers has the highest average age? [train/ bus travellers]
5. Which group of travellers has the lowest average age? [cycling/ walking traveller]
6. What does the chart show? [CO2 emissions from different modes of transport per person per kilometre]
7. Which form of transfort cause little or no pollution? [cycling/ walking, train/bus]
8. Which form of transport causes the most pollution? [car (driver only)]
b. Đọc một đoạn overview (tóm lượt) các thông tin được cho trong các biểu đồ
Overall, cars with just the driver are the most common means of transport to work and cause more pollution than all the other means of transport combined.
c. Viết dựa trên các yêu cầu sau:
- Viết phần giới thiệu nói về thông tin mà bảng và biểu đồ cho thấy.
- Phần trăm số lượng người sử dụng từng loại phương tiện
- Độ tuổi trung bình của người sử dụng từng loại phương tiện.
- Lượng khí CO2 phát thải cho mỗi loại phương tiện
- Viết phần kết luận nói lên ý tóm lược hay sự liên quan giữa các thông tin.
d. Bài viết mẫu
The table and chart show the percentages of cummuters using different modes of transport in Houston, Taxes, their average age, and how much carbon dioxide each type of traveller produces.
The most popular form of transport is the car, with 48 percent of people travelling to work onlne and a further 11 percent sharing cars to work. On the other hand, 37 percent of commuter use trains or buses, while just 4 percent cycle or walk.
Commuters using public transport are, at 47, on average three or four years older than people using private cars and thse, at 43 or 44, are for or five years older than those who walk or cycle.
People travelling alone by car produce the most arbon dioxide, slightly more than 0.3 kilos per person per kilometre. By comparison, people who share transport pruduce 0.08 kilos, whereas those using public transport pruduce only a tiny amount.
Overall, the most popular form of transport, the car is also the one which produces the most pollution.
3. Câu hỏi 3
a. Thực hành viết mô tả với thông tin cho trong bảng kết hợp với hiểu đồ
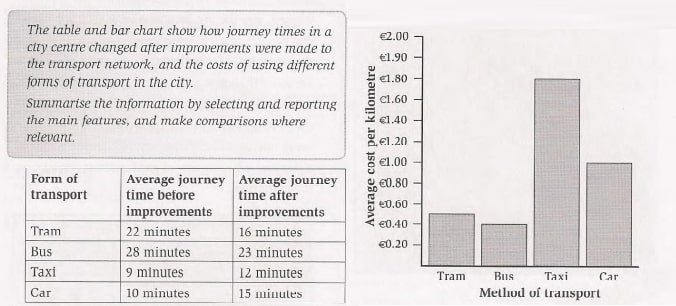
1. How many form of transport are include in the table and bar chart? [ 4 : tram, bus, taxi and car]
2. What was the fastest way of getting around the city before improvements to the transport network?
3. What was the fastest way of getting around the city after improvements to the transport network?
4. Do tram journeys take more time or less time than bus journey?
5. How much an average does it cost to travel 1 km by taxi?
6. Is it cheaper to travel by bus or by tram?
7. Which form of transport experienced the biggest rise in journey times after improvements to the network?
8. Which form of transport experienced th biggest fall in journey times after improvemets to the network
b. Để có những câu gợi ý cho phần viết mô tả biểu đồ, hãy hoàn thành bài tập bên dưới đây bằng cách chọn các từ vựng trong hộp và điền vào các chỗ trống
big cheap economical expensive fast slow
1. Cost per kilometre: 0.40 euro. The cheapest form of transport is the bus.
2. Average journey time (before) 28 minutes; (after) 23 minutes. The bus is ……….. form of transport.
3. Cost per kilometre: 0.50 euro. The tran is …….. than the bus.
4. Average journey time: (before) 22 minutes; (after) 16 minutes. the tran is …….. than bus.
5. Cost per kilometre: 1.80 euro. ………………. way of getting around the city is by taxi.
6. Average journey time: (before) 9 minutes; (after) 12 minutes. Taxis are ……….. way of getting around the city.
7. Average journey time: (before) 10 mintues, (after) 15 minutes. Cars have seen ………. increase in journey times.
8. Average jouney times (before) 28/ 22 minutes; (after) 23/16 minutes. Journey by bus and tran are …….. than by car or taxi.
c. Hoàn thành đoạn văn giới thiệu [introduction] với các từ được gợi ý trong hộp
bar graph how long how much table transport travel use
The (1) ……………….. shows (2) ……………….. it tool to (3) ………………. around a city before and after the (4) ……………………… network was improved. The (5) …………… shows (6) …………………… it costs to (7) ……………………… different form of (8)………………. in the city.
d. Hãy hoàn thành bài viết mô tả biểu đồ dựa theo các cấu trúc câu được gợi ý trong phần a-b và phần introduction trong phần c
Đừng quên đưa ra kết luận để tóm tắt nội dung chính trong bài
4. Câu hỏi 4
a. Đọc hiểu câu hỏi
You should spend about 20 minutes on this task.
The table shows the Proportions of Pupils Attending Four Secondary School Types Between Between 2000 and 2009
Summarize the information by selecting and reporting the main features and make comparisons where relevant.
Write at least 150 words.
b. Từ vựng gợi ý:
[Introduction]
– the percentage of school children
– four different types of secondary school.
[Body]
– the proportion in voluntary-controlled schools / fall / from ….. to …… from 2000 to 2009.
– the relative number of children / grammar schools ../ .. under one quarter / dropped by a half../ .. in the same period.
– Specialist schools / the relatively small percentage of pupils / (12%) / fell/ not significantly.
– the other three types of school/ declined/ the opposite/ in the case of community schools.
– a small minority / 12% / educated in these schools in 2000 / increased to well over half of all pupils / the following nine years.
[Conclusion]
– grammar and voluntary-controlled schools experienced declines in numbers of pupils
– the community schools became the most important providers of secondary school education.
c. Viết hoàn chỉnh bài mô tả cho câu hỏi nêu trên dựa trên phần gợi ý trong phần b
5. Câu hỏi 5
a. Đọc hiểu câu hỏi
You should spend about 20 minutes on this task.
The table below gives information on consumer spending on different items in five different countries in 2002.
Write at least 150 words.
Percentage of national consumer expenditure by category – 2002
b. Từ vựng gợi ý
[Introduction]
– percentages of consumer expenditure for three categories of products and services/ five countries / 2002
[Body]
– Out of the five countries / consumer spending on food, drinks and tobacco / noticeably higher / Turkey / 32.14% / Ireland / 29%.
– The proportion of spending on leisure and education / highest / Turkey / 4.35% / expenditure on clothing and footwear / significantly higher / Italy / 9% / in any of the other countries.
– Sweden / have the lowest percentages of national consumer expenditure for food/drinks/tobacco and for clothing/footwear / nearly 16% / 5% / respectively.
– Spain / have have slightly higher figures for these categories / but/ the lowest figure for leisure/education / 1.98%.
[Conclusion]
– The largest proportion of consumer spending / each country / go on food, drinks and tobacco.
– the leisure/education category / the lowest percentages / in the table
c. Viết hoàn chỉnh bài mô tả cho câu hỏi nêu trên dựa trên phần gợi ý trong phần b